
If Matlab is started in one of these directories the main routine is run by default (from startup.m).First A first experiment for VDSL using mostly predifined definitions and routines. Simple An example main with many special definitions (i.e., scenario and tfplan). GUI_VDSL The main graphical user interface (GUI) example for VDSL experiments. PBO Example of a PBO experiment for VDSL using Reference-Frequency (Constant) power back off (PBO). MixedServices Example of testing many VDSL PBO methods on mixed service scenarios.
More to be written here...
More to be written here...

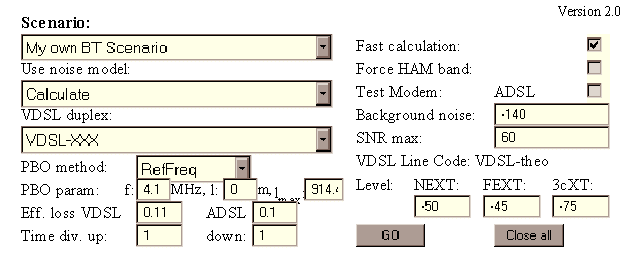
With a menu selection one can select a scenario among a set of FSAN predefined scenarios. The topology and traffic setup for this scenario is shown as a sub-figure below the setup section. In the second menu it is possible to select if a pre defined FSAN noise model should be used or if it should be calculated from the scenario itself. The third menu makes the selection of VDSL modem/duplex method. The PSD mask for this modem is shown in a sub-figure below the setup section.
Connected to the VDSL duplex is the power back off (PBO) method. Currently there are four methods defined: reference length (RefLen), reference FEXT (RefFEXT), reference Noise (RefNoise) and reference frequency (RefFreq). If no PBO is wanted a "None" is selected in the PBO method menu. Two PBO parameters can be set: a length (for RefLen or RefFEXT) or a frequency (for RefFreq). For the RefFreq method a maximum length can be given. Also connected with a duplex method is an efficiency loss figure where efficiency losses due to cyclic prefix/suffix, guard bands etc. can be stated.
For time division duplex methods a time division can be given for up respectively down stream (for frequency division methods this is given as 1 and 1).
There are three flags that can be set.
With the button "GO" the experiment is evaluated and a result window
will appear. With "Close all" all windows will be closed (including the
setup window).
The following examples show what can be made in the user definitions file:
The middle section of the result window contains bit rate information for each of the modems under test. For the downstream and upstream rates the numbers within parentheses are the xtalk margins to the given bitrate.
In the menu at the top left corner of the plot it is possible to select plots from any of the simulated modems. With the PlotIt button the plot is redrawn in a seperate window, thus allowing for further manupulation, e.g., zooming. A logarithmic frequency axis is possible by selecting 'Log' in the menu near f axis type.
For the plots in the result window:
The whole experiment is run from the MixedServices.m file and is a relatively complex example of how to set up complex PSD definitions (dynamic frequency plan and dynamic PSD mask containment), as well as dynamic tt structures.
More to be written here...